Security in Obscurity
A thought by Jeff Stein
Different ways to use a $token$ in Splunk
With the right knowledge you can use tokens to not just display data but rather engage your audience by providing them the tools to interact and guide the visualization of the data, January 2019
Working in information security I find Splunk is a very beneficial tool to use in normalizing and reviewing data to identify areas of concern. Dashboards are a great way to visualize that data in Splunk. With the right knowledge you can use tokens to not just display data but rather engage your audience by providing them the tools to interact and guide the visualization of the data. With that in mind I thought I would highlight some of my favorite ways to leverage tokens on a dashboard.
Understanding the basics
For a bit of background, the core of a dashboard in Splunk is made up of panels. The panels on a dashboard will contain your visuals. Think of these panels as the building blocks of your dashboards and allow you to move your visuals around in a number of different ways. Each panel on a dashboard will always consist of a search and a visual to display that search. By clicking on a visual you can drill into the data behind that visual and have it open a new dashboard, a search in a new browser window, or to make a truly dynamic and interactive dashboard, you can use tokens with your panel drilldowns.
If you have any programming experience you can think of tokens as something like variables. In the simplest terms you create a token, which would be a name you create for a value of something in your data. For example, the token could represent the name of a machine. It will then represent the value you define in your dashboard as it changes from machine 1 to machine 2. On your dashboard, tokens will be a string sandwiched between two dollar signs [$text$].
Why tokens are so valuable is because you can use them to access and pass the values they represent to create more interactive dashboards. When a token is returned by a value, by clicking on a visual to drill into data for example, the dashboard audience can get immediate feedback on the data they wish to see. Unlike other drilldown options in Splunk dashboards, this view is done on the same page without having to open additional dashboards or search to see the updates to the visualizations
Drilldown Panels
The first way you can think about leveraging tokens on a dashboard is probably one of the most common ways to use a token. You can use a token to configure one panel's search and visual to be dependent upon a token representing data in another panel. As I previously mentioned this will allow your drilldown to show up on your dashboard without have to review another linked dashboard or search.
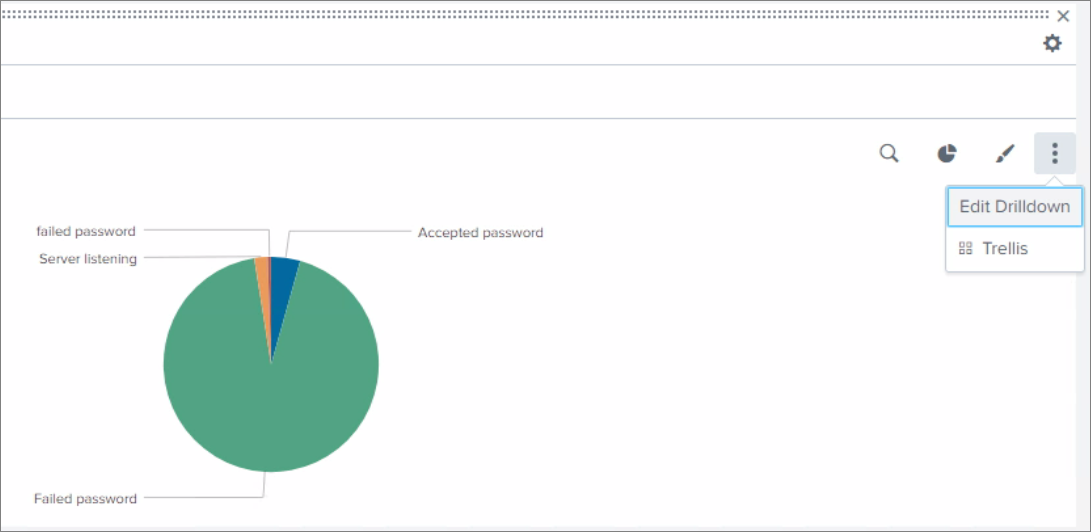
The basics of configuring this and use of the token can all be done directly from the UI in a the dashboard. While in edit mode on the dashboard click the three vertical dots in the panel which contains the data you want to represent with a token. Then click Edit Drilldown.
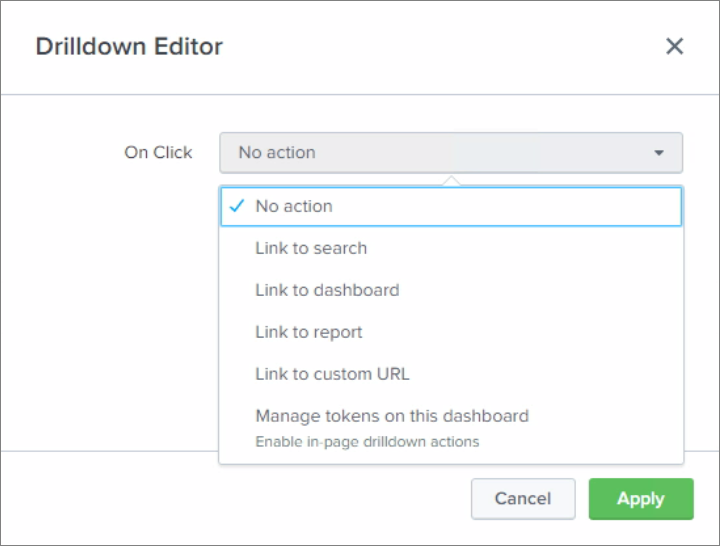
The drilldown editor will now appear. You will now be able to control how to drill down on the data in your panel. To create your token you will want to choose the option to Manage tokens on this dashboard.
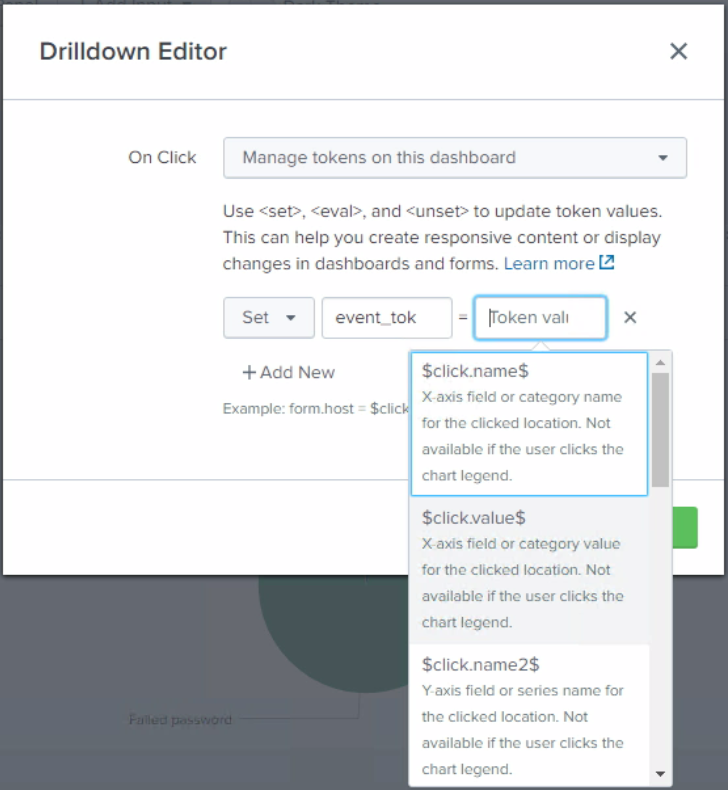
You will then have the ability to define the token. You can define multiple tokens here by just clicking +Add New. When creating a token the name you are defining for your token will be entered in the first field while the second field will contain the value you are looking to represent. For my example I have named the token event_tok and choose a value of $click.value$.
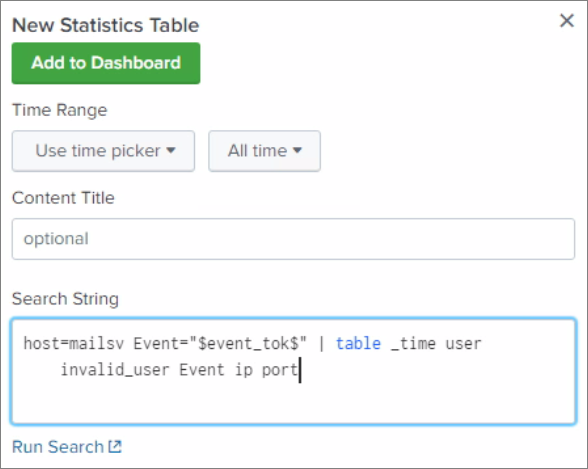
You can save your configuration. You have now created your token named event_tok. You can use this token and the data that it represents in other panels on your dashboard. A simple way to accomplish this is by entering the token in a panel search. Below you can see I have created a new panel and added the token in between two dollar signs ($$) to represent the value of the field Event in my search.
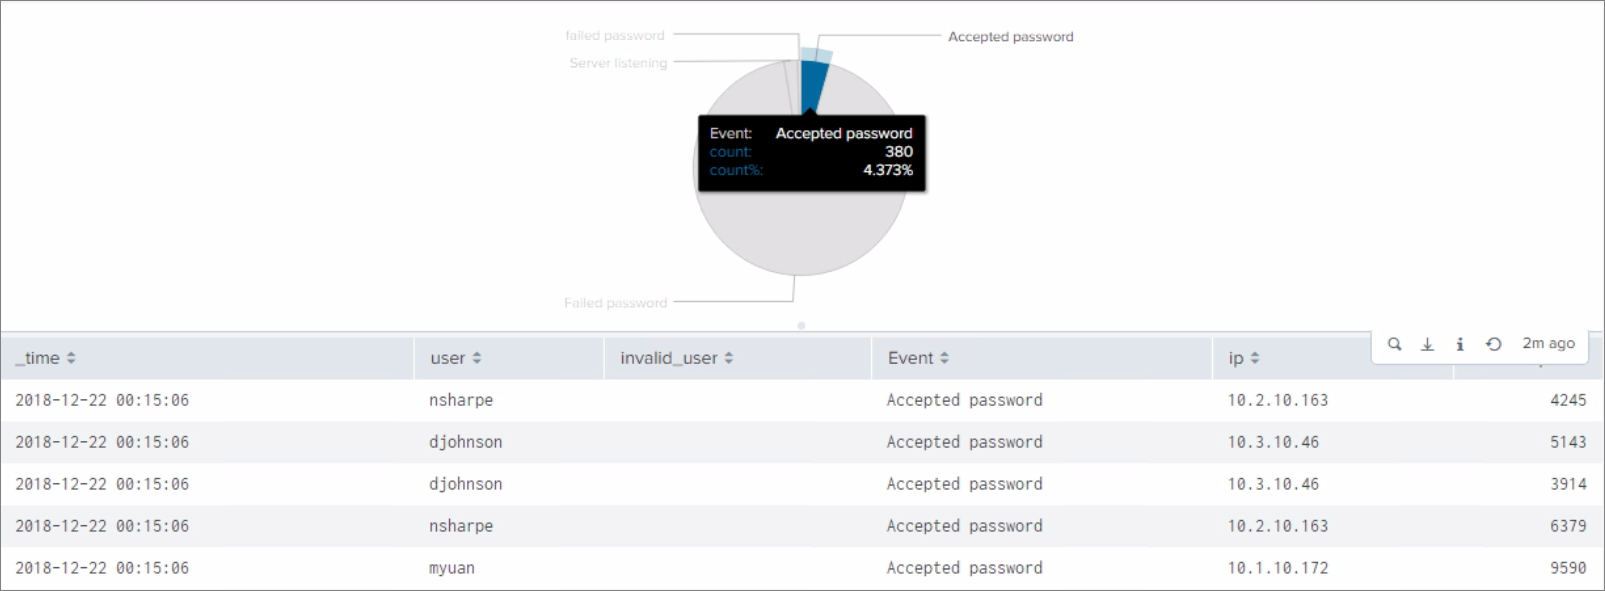
Once saved what will now happen is anytime a value or visual is clicked on in the panel where the token has been configured, the search in the drilldown panel will now update the value for the field being searched. That will have the desired effect of dynamically changing the content of what you search and can be used to represent a drilldown or filter other content on the dashboard. In the example I have been using this will have the effect of displaying a list of users with Accepted passwords because I have clicked on the Accepted password category on the pie chart in the panel above where the $event_tok$ token has been defined.
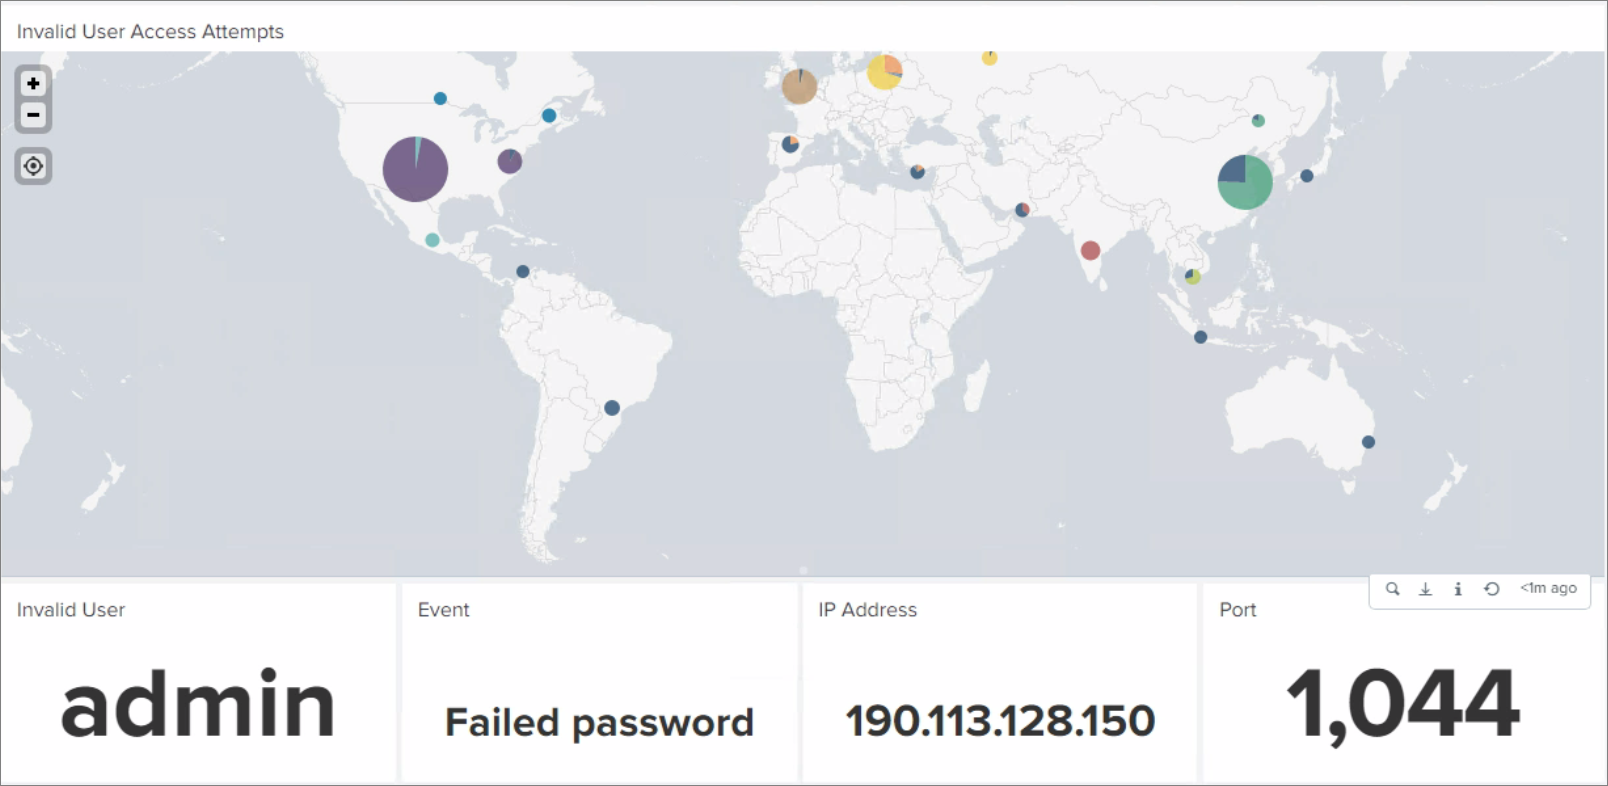
A single token can be used in more than one panel. To see this in action hover over the example dashboard below displaying a map of all of the invalid user access attempts across the world. You can see how not just one panel but all of the panels below the map will update based upon the dot clicked on the map.
Hidden Panels
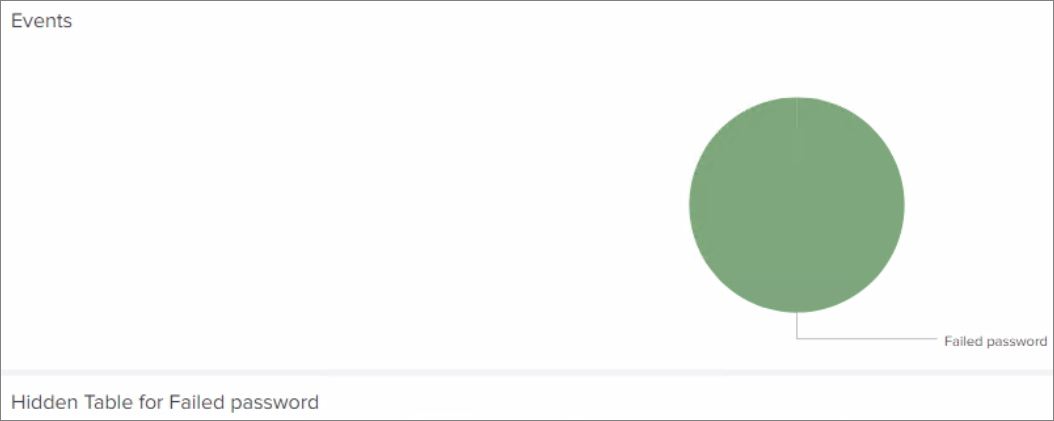
Tying into configuring the panel search to be dependent upon a token in another panel, you can also leverage tokens in one of my favorite ways by creating a hidden panel that will only appear on your dashboard when you click on a visual in a panel to drill into the data it represents.
You can create a hidden panel effect on either a new or your existing panels on a dashboard.
To configure this open up the XML source of your dashboard while in edit mode.
You will look for the
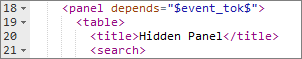
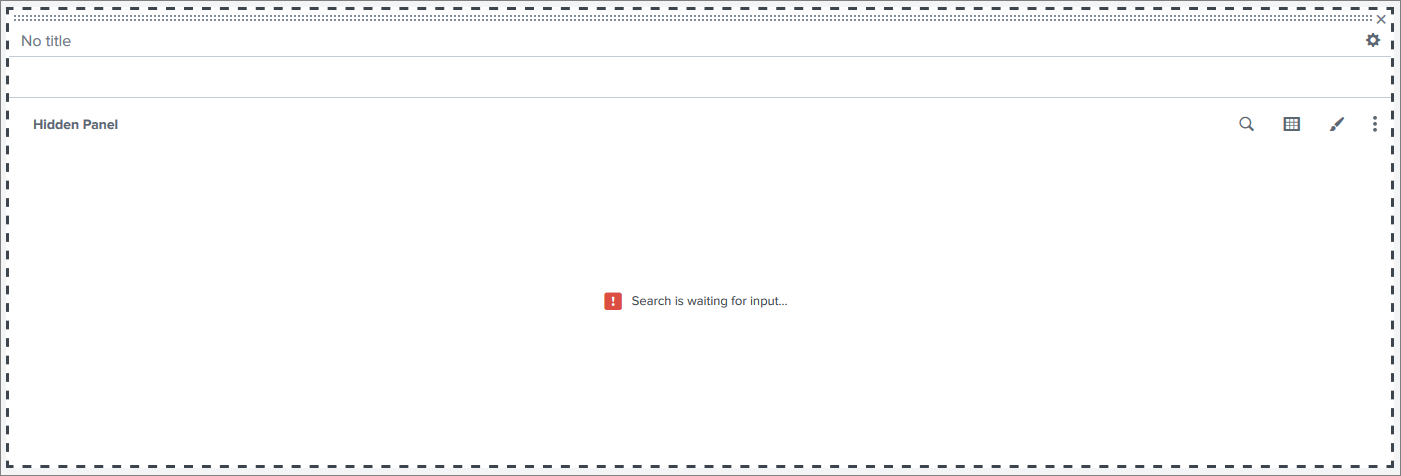
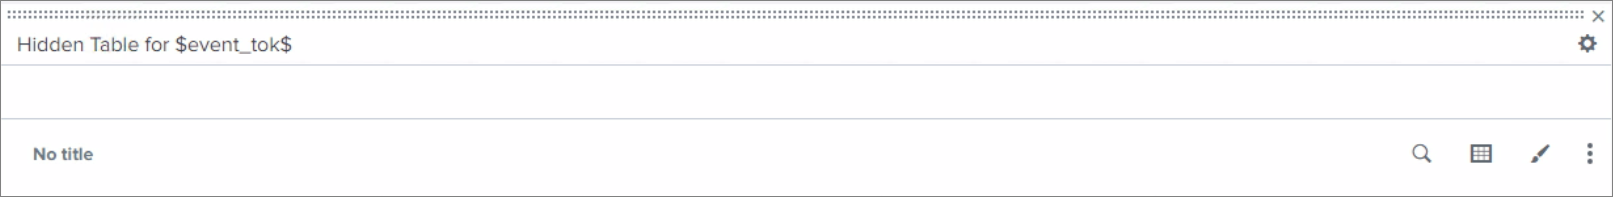
The $token$ will represent the token you wish to key the panel off of. Once you click on data where that token has been configured the panel will appear on the dashboard displaying the represented data you wish to see. If you click on new data where the token has ben configured, the display in the hidden panel will change to show the new view based upon your token.
Once you have made the changes to the
Dynamic Titles
Aside from visuals, you can also use dynamic content in your titles on a panel. This is a cool little trick that allows you to categorize a visual on a dashboard based upon what token is being used to display data. To enable the use, you simple will add a $token$ to any of your titles in a panel of your dashboard. You can use the token to replace a word, or append to the beginning or end of the title you have created. Once configured, the $token$ will be replaced with the value which the token is representing. Below you can see an example of the configuration.
Once saved, the token configured to represent password attempts will now show the data in the title of which category has been selected from the pie chart.
Inputs
The final way I like to use tokens is also one of the most common ways you will probably leverage a token on a dashboard. This is by creating an input to filter data and the visuals on your dashboard. Technically adding inputs to your dashboard will turn it into a form however the structure and configuration will remain mostly the same. There are a variety of inputs that you can add to a dashboard including free-form searches, dropdown lists, multi-select lists, radio buttons as well as time-based inputs. To start working with inputs click on the Add Input option while in the UI edit mode on your dashboard. You will then see a full list of available input types to choose from.
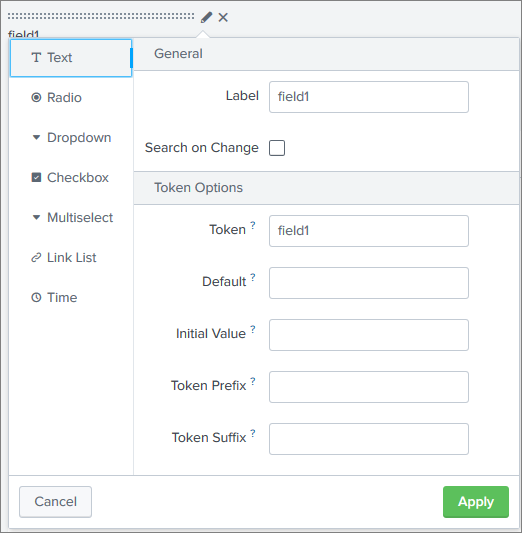
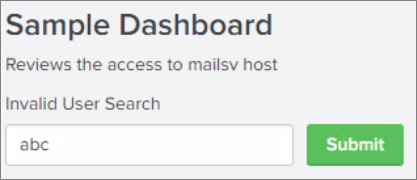
Once you have made your choice you can configure the input in a number of different ways depending upon the input type chosen. Common configuration options include static or dynamically generated values for tokens as well as default values for your input. For my example I will create a free-form text input. After selecting the Text option you will see the input added onto the dashboard with a default field title. Clicking edit in this input will given me the option to change the title of the input as well as generate a token name to represent the input in searches. Additionally you can create a default value for the token.
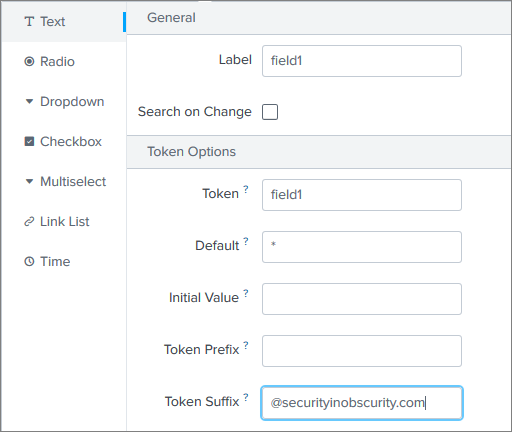
I am going to configure the settings by adding wildcard default valuing for the token meaning that it will search all values as the default state when applying to the dashboard. Additionally I have added a token suffix so that whenever text is entered into the field the value will be appended with @securityinobscurity.com. Note that these configurations are optional items and are not needed for your input to function. Required fields here are Label and Token.
After applying the configuration and saving the dashboard you can now use the text field to search and filter information on the dashboard by entering free-form text. Anywhere your token (in this case $field1$) has been set in a panel, the data will dynamically change based upon information entered in the field.
There are a variety of ways to use tokens on a dashboard. Leveraging tokens will enable you to create dynamic dashboards that can be used to depend upon to understand data and rely upon when using dashboards in making decisions. The tokens I have highlighted are some of my favorite use cases that can add real value to how a dashboard is leveraged. Using tokens will give your dashboard a framework to work with the data that can enable the dashboard audience to be in the driver seat when it comes to what they want to see.
Tags
Security Vulnerabilities IDS/IPS Malware Ethical Hacking Policies PowerShell Python Splunk Cloud Script PKI Firewall Router Vulnerability Management